- Democratize access to customer data across the organization
- Gain more real-time insight into user flows
- Enable data-driven decision-making across product teams
- Spend less time querying customer data for product use cases
- Conserve data analyst time and bandwidth for larger initiatives
Prezi
Using Product Analytics to speed new product adoption
Indicative helps Prezi gain a better, real-time understanding of their varied user base and transform that insight into data-driven decisions that speed adoption of new products and features.

Overview
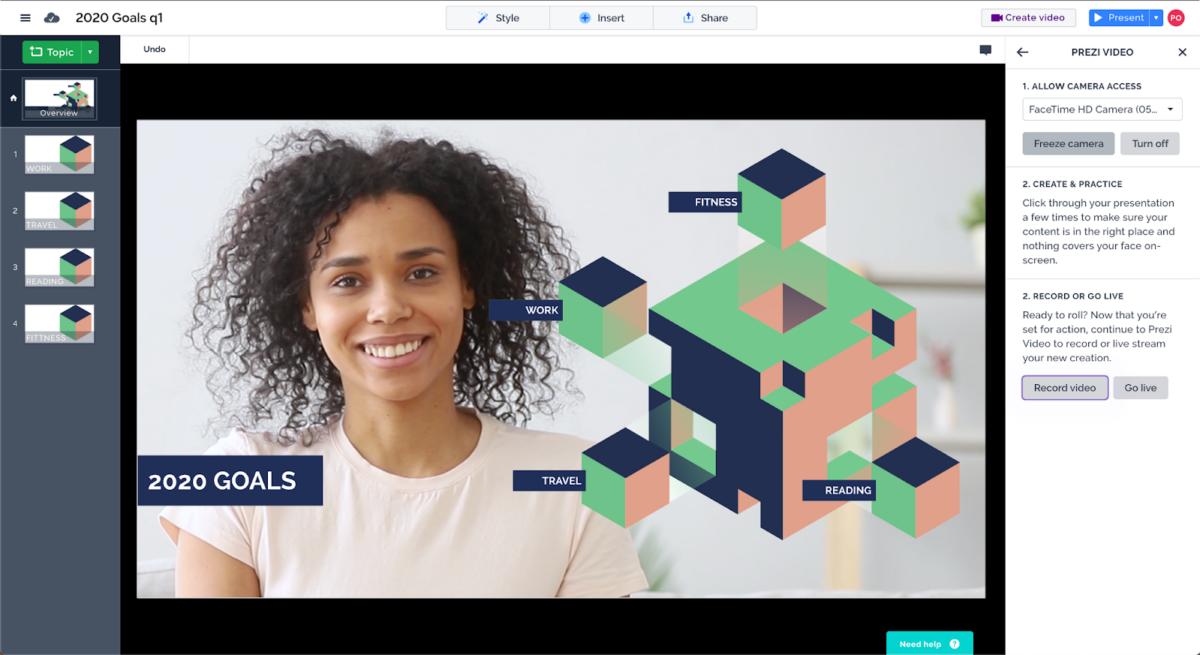
The presentation market was ripe for change when Prezi launched in 2009. Business users and educators alike were ready for a more flexible and engaging alternative to PowerPoint. Since then, Prezi has grown into a global powerhouse, helping more than 100 million users create over 360 million presentations—both in-person and virtual. The platform’s signature offering, Prezi Video, is the leading virtual presentation tool for live and recorded video.
Now offering three different products, Prezi is on a mission to help a wide range of business professionals and educators reach their audiences in a more powerful way.
To support such a broad and varied audience, Prezi needed a way to bring customer data to the forefront of their decision-making process and to do so in real-time.
Using Indicative, product teams are able to create insightful end-to-end user flows. Indicative also helps teams from across the company to quickly and easily access the actionable customer data they need—freeing up data analysts to focus on bigger picture initiatives.
Challenge
A global company, Prezi’s customer base is large and varied, encompassing a range of users that span business professionals to educators to non-profit organizations.
To serve that wide base, Prezi needed to be able to access Product Analytics and customer data in a quick, useful way. They needed to create meaningful user flows that everyone—from product managers to data analysts—could access, understand, and use.
As Jose explained it, Prezi was facing a big problem with the way they analyzed customer data: They were drowning in white noise that obscured meaningful customer insights.
Before implementing Indicative, teams across the organization lacked the clarity and focus to track the right customer signals. That led to a ton of static obfuscating any serious, effective use of customer data, hindering product development. Product managers had to make product development decisions based on anecdotal evidence and gut instinct.It also created a less-than-ideal situation where product managers relied heavily on data analysts to pull any kind of insights out of their customer data. That meant data analysts spent a lot of time bogged down creating queries for product managers—meaning many bigger picture, more complex issues went unaddressed.
In 2019, the team needed to launch a new product to cater specifically to virtual presentations and videos. Facilitating a smooth rollout and quick adoption among their users was a key challenge for Prezi.
With their previous data setup, they didn’t have access to the real-time, objective information they needed to stay agile throughout and react quickly to the realities of a new product launch. With Prezi Video, the team wanted to take a more data-driven approach to the rollout. They needed to be able to see, in real-time, whether users were adopting the new feature, how they were using it, and which power users might be able to offer more insight into new product adoption.
- Better understand user behavior across a varied audience
- Create meaningful user flows that drive decisions
- Expand access to customer data across the organization
- Gain a better understanding of product and feature usage across product and user types

Solution
After weighing the current, partial solution Prezi had implemented using Chartio against both Amplitude and Indicative, the team ultimately chose Indicative based on cost, ease of integration, the ability to connect directly to their data warehouse, and customer support.
Jose and team implemented Indicative and saw an immediate shift in how product managers and their teams used and related to customer data. PMs were able to build their own user flows, freeing up data analysts to spend more time supporting bigger company initiatives.
Now, all cross-functional product teams use Indicative to regularly analyze user behavior, to understand how different features perform, and to identify key opportunities to improve them. They’ve also mapped out broader user flows that make it easy for product managers to pinpoint and understand the core metrics of user behavior.
That shift was particularly evident during the Prezi Video launch—they used Indicative to quickly map out key users flows for the new product. The product manager in charge of the rollout kept a keen eye on those user flows and real-time dashboards to monitor adoption and usage of the new feature over time. That way, they were able to ensure users adopted the new feature, identify points of friction that halted or slowed adoption, and make agile changes to alleviate friction and speed adoption.
- Get a Product Analytics platform integrated into the company’s existing analytics stack quickly, speeding up data refresh and time to value
- Build out in-depth user flows and feature usage dashboards to easily identify drop off, points of friction, and how different groups break from the expected customer journey
- Use customer data to make more intelligent, data-backed decisions to power product development
- Save time for product managers and data analysts alike
Results
Indicative helps Prezi inform and validate several core company metrics, including a new success metric recently added to their Indicative events. The new metric helps the team uncover how various features impact overall company success.
Jose highlights Indicative’s self-service platform as a game-changer for their team. They’re able to visualize user flows quickly enough to monitor them daily—meaning product managers can make much faster changes to the product, reacting quickly to issues and opportunities alike.
For example, during the launch of the new Prezi Video product, that access to real-time customer data and dashboards enabled the product manager in charge to see immediately how users were implementing the new product. They even identified a few power users to interview for more insight into the new product’s performance.
- Better understand and serve a wide and varied customer base
- Empower product managers to be more data-driven
- Enable faster implementation of product changes
- Allow data analysts to spend more time on bigger picture efforts
Don’t get left behind in a data-driven world.
Try Indicative for Free.