
Every company, of every size — even organizations of just one person — are navigating a data avalanche problem. There’s more information on hand than organizations know how to use or manage.
Every team — from product to marketing, and IT to engineering — is generating data. A strong analytics stack is foundational to being able to make sense of it all. Investing in a robust and efficient analytics stack is a necessity for a modern business in order to compete. It empowers each team across the organization to make data-driven decisions, with access to reporting and ad hoc analysis.
What Technology Do You Need in Your Stack?
The data and analytics space is rapidly growing, expanding, and evolving. As technology develops, analytics stacks become easier to set up, manage, and scale. The technology you choose will help you navigate your business into the future. It is important to customize the components of your analytics stack to meet your business’s unique needs.
Here are the key components of a data analytics stack and how they all fit together to enable data-driven decision-making. Keep reading for an explanation on how to select the right stack for you, below.
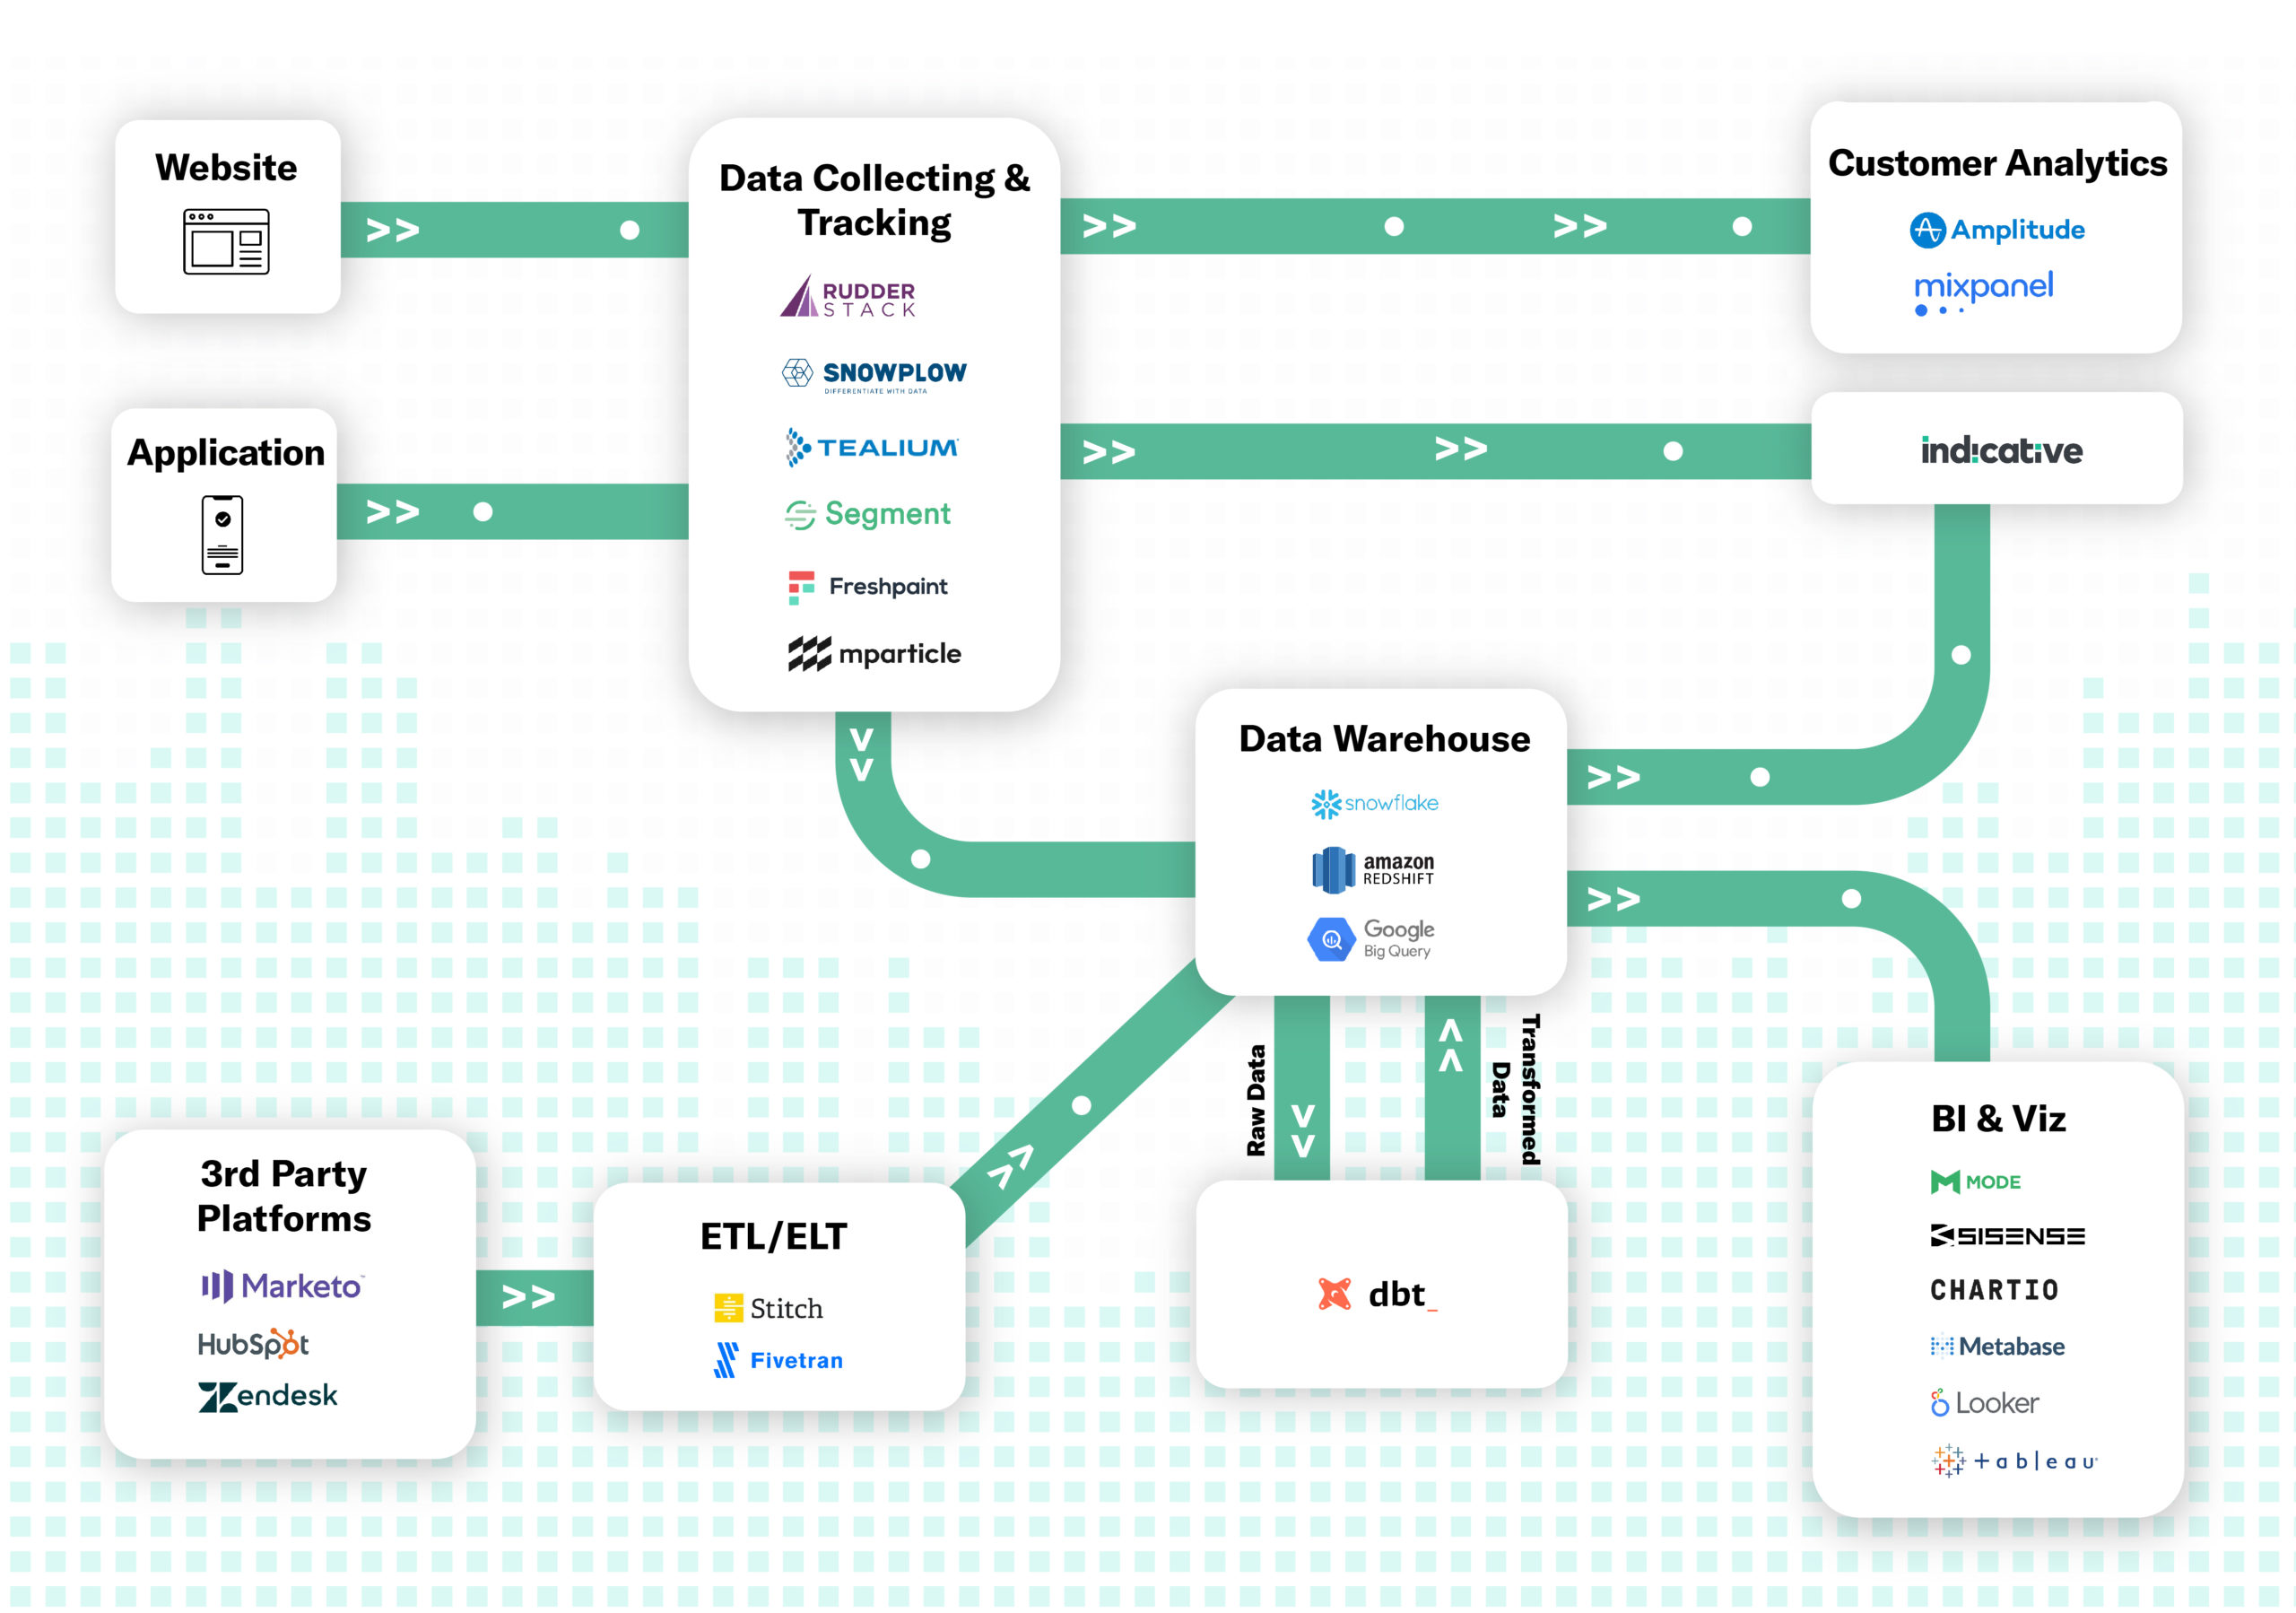
Data Tracking and Collection
Data tracking and collection is the first milestone in building out your analytics stack. Selecting a solution for this is fundamental to understanding who is doing what on your website or product. Note: It is important to keep in mind which downstream platforms or systems you’ll want to send this data to, as each solution has a different selection of integrations.
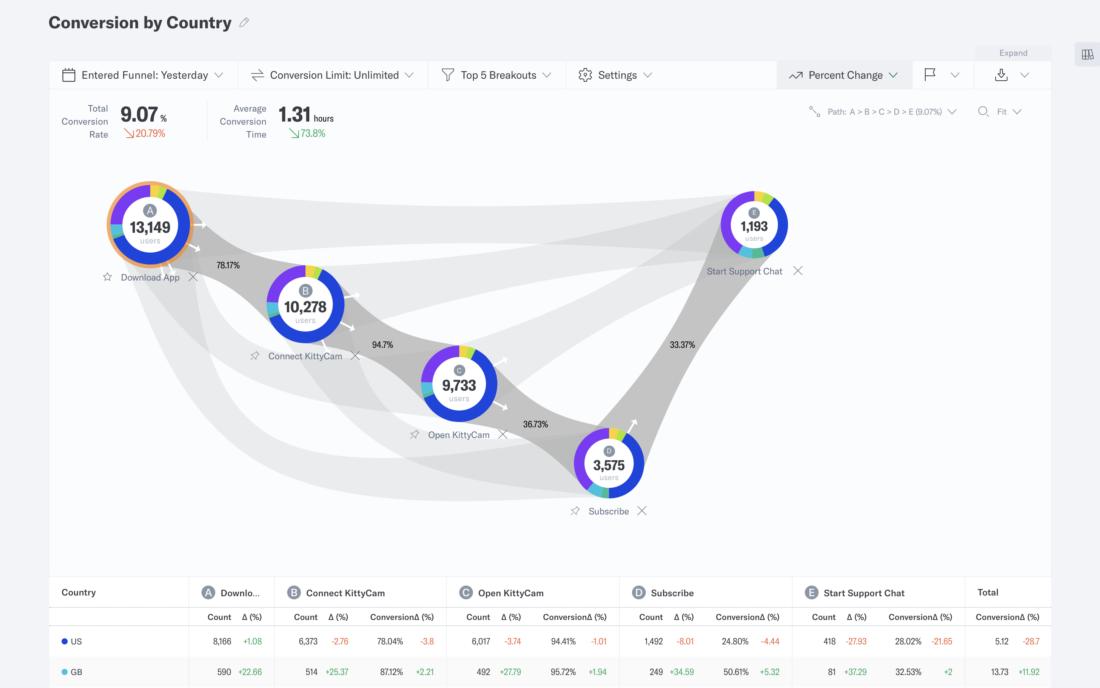
In the video below, you’ll see a snapshot within Indicative, that shows how creating a profile can change how likely a person is to convert by making an in-app purchase. Data tracking, at the person and device level, makes this perspective possible. This is also referred to as event data.
![]()
Event Data
In the video above, you’re seeing people navigate through event data. “Events” are user actions, or what a company would define as a meaningful transactional moment.
For example, a product team might be interested in events related to “repeat usage” or “churn.” A marketing team might be interested in analyzing different points of conversion on a website
Here’s a valuable perspective that Yali Sassoon, co-founder and analytics lead at Snowplow Analytics, writes for the company blog:
“We find that those companies that are most successful at using Snowplow data are those that actively develop their event data models: progressively pushing more and more Snowplow data throughout their organizations so that marketers, product managers, merchandising and editorial teams can use the data to inform and drive decision making.”
He also elaborates that event data modelling is a relatively new field, which means that processes will likely be evolving. Event tracking infrastructure needs to be solid.
Major Players
- Segment: Segment collects customer events from your web & mobile apps and provides a complete data toolkit to every team in your company. Segment is best for teams who want an out-of-the-box data schema and tracking infrastructure, and do not need greater flexibility with tracking. The platform’s strict schema makes it easy to turn more than 200 integrations on and off. That means once engineering sets up tracking for their products using Segment’s SDKs, sending that data to any destination and pulling 3rd party data is quick, easy, and does not require further engineering resources.
- Snowplow: Snowplow is an open-source web, mobile, and event analytics platform. Since it’s open-source, the OS and paid versions are both built directly into your infrastructure. It never leaves your infrastructure, so all data remains fully owned by you. That makes Snowplow a great option for those concerned about data privacy. Snowplow is also highly flexible and customizable, giving engineers more control over building an infrastructure that best meets their needs. However, due to greater flexibility, more engineering investment is required during setup and maintenance.
- mParticle: mParticle is a mobile-first customer data platform that offers support for web data, too. One of the few options truly built for mobile and app data, mParticle gives users access to more data than other solutions, including push tokens, exceptions, device telemetry data, and more. The platform also offers audience segmentation features, with the option to connect audiences to major marketing and advertising platforms, making it easier for business users to implement audience data.
- Tealium: Tealium skews toward business users across the organization. Promising to break down silos and unify data, the platform offers more than 1,000 pre-built integrations to bring all your data together and make it universally accessible throughout the organization. A cloud-based solution, data flows through Tealium, so like Segment and mParticle, it’s best suited for companies without strict privacy needs.
- Freshpaint automatically tracks every possible event, then provides a UI for users to create and manage those events. That means Freshpaint requires the least amount of engineering resources over the other options mentioned above.
- Rudderstack markets themselves as the customer data platform for developers – an open-source alternative to Segment. Since it’s open-source, it provides more data privacy than cloud-based solutions, while offering a lower-cost alternative to popular options like Segment.
ETL vs. ELT
These acronyms correspond to data integration processes for transferring information. With ETL, data is extracted, transformed, and then loaded. This is the traditional method for data warehousing.
ELT swaps those last 2 steps — extracting, loading, then transforming. The difference alters both when and where data transformation is done. Using ETL, transformation happens before loading and is done within the ETL platform. With ELT, data is moved to the data warehouse before transformation. There are 2 main implications of that distinction:
- Data privacy. For companies concerned with privacy, ETL allows you to clean, mask, and secure data before moving it to the data warehouse.
- Speed. ETL front-loads transformation and back-loads speed, making it faster to pull analysis-ready data from the warehouse. ELT does the opposite — data loads more quickly, but it will take time to transform it before any analysis can be done.
Choosing between these two processes depends on the exact problem that needs solving.
Major Players
With ETL tools like Stitch and Fivetran, it can take as little as an hour to set up scheduled ingestion jobs, and you should be able to avoid needing to write any code.
- Fivetran: Fivetran is likely the more cost-effective ETL option and allows for multiple data warehouse connections.
- Stitch: Stitch only allows for one data warehouse connection, but it builds ETL into your data infrastructure — making it the more secure option.
The most important consideration between the two solutions is how many upstream and downstream integrations you need. Stitch is ideal for smaller data sources but can become expensive when data ingestion needs scale.
Since Stitch’s pricing is based on the number of records replicated per month, it may be best to use Stitch for ‘smaller’ integrations, where you’re ingesting less data.
Fivetran is ideal for replicating a lot of data. From a cost perspective, the fixed price per connector model means you can replicate as much data as you like. Also noteworthy: Stitch allows for only one data warehouse connection, whereas Fivetran allows for multiple.
Tools like dbt can also be used to perform the “Transform” part of ETL for data already in a data warehouse. dbt is a command-line tool that enables data analytics and engineers to transform data by writing select statements.
Data Warehouses
A data warehouse is a centralized storage container used to consolidate company data, which is accessible to different departments in an organization. Out of all of the components of a data analytics stack, data warehouse technology has experienced the most evolution in the last several years.
Here are some factors that you may want to consider when choosing your data warehouse:
- Scalability, so that you can easily store and transform terabytes of data with a few simple processes
- On-demand pricing, meaning that your data warehouse can evolve with your business
- Easy setup, so that it’s possible to get up and running quickly
- Solid customer support, in case something goes wrong
Major Players
There are a few dimensions by which you’ll find yourself evaluating options for data warehouses. Some of the most dominant players are Amazon Web Services, Google Cloud Platform, and Snowflake. So how do they compare with each other?
Price. Google BigQuery, and Snowflake are currently considered the best offerings, with low storage costs, high processing speeds, and on-demand pricing. Amazon Redshift is more cost-efficient for everyday data warehouse needs, but it becomes less cost-efficient with businesses looking to do data mining or with extremely variable workloads. Tools like Intermix can be used to optimize your Redshift warehouse for performance.
In sum, cost projections are complex and vary greatly based on each company’s specific needs, but each solution provides helpful online cost calculators:
Performance. Amazon Redshift is ideal for normal business processes that occur during business hours. It’s cost-effective, can handle complex schemas, and is designed to be easy to use. BigQuery is ideal for handling niche business process workloads that query big chunks in a small time frame. It is also useful for data science, engineering, machine learning, and data mining. Snowflake consistently outperforms BigQuery on a number of performance metrics, according to benchmark tests performed by technology blog GigaOm.
Ultimately, you’ll need to make a decision based on your unique infrastructure and considerations.
Manageability. BigQuery is known for being simpler than Redshift out of the box. BigQuery doesn’t require many tweaks, simplifies cluster management, and handles the complexities of database configuration. Also, a large benefit is that it supports nested data classes due to Dremel capabilities. With Redshift, there’s a need to flatten data before running queries. Snowflake also offers advanced scalability features, like supporting instant scaling, whereas Redshift takes minutes to add more nodes.
Business Intelligence and Data Visualizations
Within your analytics stack, BI is about making your data consumable to humans. The information that you collect, through a series of transformations and manipulations, becomes consumable by the human eye.
With your BI infrastructure in place, everyone within an organization can align around a common set of perspectives — a single source of truth. Every one, individually, also gains the freedom to conduct their own exploratory analyses. Data visualizations become possible.
There is an overwhelming number of business solutions available for organizations to consider. Depending on the size and needs of your organization, you may need multiple tools.
These platforms vary in their levels of sophistication. Some solutions are designed for engineers, which makes them inaccessible for less technical people. Other solutions (in sub-categories of BI like Customer Analytics — such as Indicative) have been designed to use without coding or SQL, making them more useful for those in product management, marketing, and data analyst roles.
Think of your BI platform as a resource for making your data functional.
Every BI solution has its own unique strengths and features. Here are a few to consider:
- Looker creates a data modelling layer, through LookML, on top of your raw data. That gives users the ability to model various business metrics, dimensions, and aggregate views. Business users can use these for different output visualizations and dashboards. Looker is known for its interactive interface.
- Sisense gives its customers — product managers, developers, and data professionals — the ability to turn complex data into analytic apps.
- Metabase is designed to support a question and answer structure. The idea is that someone can ask questions to its dataset and then share these outputs with fellow teammates.
- Chartio helps people create dashboards for people to share within their organizations. The emphasis with this solution is on sharing, enabling anyone at an organization to embed data into communication.
- Mode enables teams to perform exploratory analyses of data sets. To use this solution, you’ll need to be proficient in SQL and python, making it most valuable for people who can code.
- Tableau specializations in data visualizations and connecting first-party company data to external sources. The platform also supports natural language, meaning that seekers of information can ask questions in human language.
The BI you choose comes down to function, use case, and usability. However, these tools are ultimately limited by the constraints of SQL-based analytics, specifically customer time-series analysis.
Enter Customer Analytics
Customer Analytics is a type of BI, developed for the purpose of answering complex customer journey questions in real-time, without the need for SQL. Unlike SQL-based systems that struggle with articulating these types of queries, Customer Analytics is designed for behavioral data, speeding up existing analyses and revealing strategic insights. As such, these tools help teams collaborate more effectively. Indicative’s platform is designed to help product and marketing teams align around their operations.
Customer Analytics examines the “what’s” and “how’s” of customer behavioral data to inform the “why’s” of customer behavior. This can include tracking page views, product usage, or other important actions like registration. These critical day-to-day insights allow users to further optimize for conversion, engagement, and retention.
In addition to Indicative, other Customer Analytics platforms include Amplitude and Mixpanel. Each has its strengths and weaknesses.
- Indicative enables you to analyze multipath funnels so you can understand the various paths to conversion, while Amplitude and Mixpanel do not.
- To send targeted messages to user segments, Indicative offers greater flexibility, while Mixpanel offers basic messaging functionality in-app. With Indicative you can use the flexible User Segments API to send segments to your messaging platform of choice.
- Indicative offers the most generous event volumes, with 50 million monthly events for free and 250 million monthly events for its Professional tier. That’s compared to Amplitude’s 10 million for free. Mixpanel charges based upon MTUs (monthly tracked users), which yields even less capacity.
- Indicative is the only Customer Analytics platform that connects directly to your data source without duplicate tracking — whether that’s to a data warehouse, through a CDP, or via API.
For a more detailed comparison of these 3 Customer Analytics platforms, take a look at this breakdown from G2, here.
Final Thoughts
The best analytics stacks can adapt and evolve to the needs of your business. In the coming months and years, this adaptability will be mission-critical to getting ahead in today’s often uncertain, fast-moving markets.
The highest performing analytics stacks will empower people to make their best judgment calls, and enable technical processes (like data tracking and transformation) to run smoothly behind the scenes, without diverting team bandwidth or resources.
Your analytics stack needs to be future-ready, now. To do that, your analytics infrastructure should have the following qualities:
- A strong foundation – A foundation that is strong enough to build many complex processes upon, without sacrificing performance as your business expands over time.
- Adaptability – Be adaptable enough to meet the needs of precise end-user experiences such as application integrations or, as in the case of Indicative, creating a shared perspective between product and marketing teams.
- Scalability – Be ready to scale to meet the needs of the business, without needing to make significant adjustments to your technical infrastructure.
An important step to take before choosing components of your analytics stack is to thoroughly define your use cases. It is also helpful to plan for how your company’s needs may expand over time.
Give careful thought to both application and end-user focused objectives, as audiences for your data will be both humans and machines.
Explore Indicative Now – no strings attached

 Indicative Team

